May 2, 2014
This article provides a couple of useful tips for how to assess a market more thoroughly and truly get to grips with the composition of the area.
Tips on “sense checking” the viability of a local market when setting up a franchise.
Something we are keen to dispel at Atlas Mapping is that each territory across a franchise network can hold an equal level of opportunity. Regardless of how much effort is put into balancing the number of households or businesses in a territory, each franchise will operate in a different environment. For example, can a territory of 100,000 households in London ever be comparable to a territory with similar households in Cornwall? Of course not, this article provides a couple of useful tips for how to assess a market more thoroughly and truly get to grips with the composition of the area.
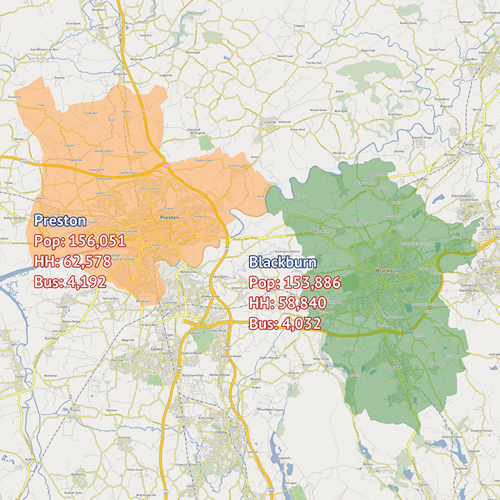
Let’s start with a comparison of two similarly sized locations in the North West – Preston and Blackburn. Our first recommendation when looking at any new market is to understand the market size. After all, this will primarily dictate the viability of a franchise and the expectations of a franchisee.
NOTE: If you currently gauge franchisee performance by levels of turnover, we recommend looking at levels of market penetration too. Sometimes a franchisee can be doing incredibly well with a much smaller commercial opportunity than their peers.
By assessing the top level demographic information such as population, households and number of businesses in both cities we can see that they are extremely similar in market size. Immediately as a franchisor you are armed with an understanding of the commercial opportunity each franchisee covers and can safely start making genuine comparisons between franchisee performances in these areas.
These two cities are comparable in size and representation over a number of demographics; however, the percentage representation of Asian ethnicity is a point to note. Blackburn holds almost twice the level of this particular ethnic group, as can be seen from the image below. Ethnicity does not have an effect on all products and services but the point remains that the markets do have some differences. Spotting the key attributes relevant to your business is the key. For example, does one city have a larger representation of students than the other, or is the representation of white collar business more prominent?
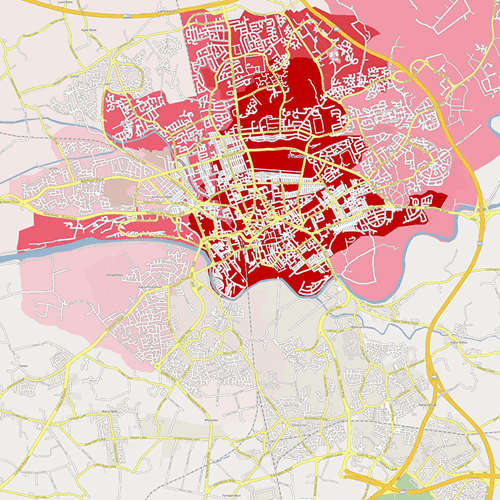
Another point to focus on from this image is the clear split of communities in Preston that is North and South of the river. This is a feature often seen across the UK and indeed cities across the globe. Communities tend to grow around or in between geographic obstacles such as rivers and man-made features like motorways and railways. Though the markets are mostly similar it is important to take the next step and look at how your business model operates and what factors could affect performance. For example, if you are site based should you perhaps consider two sites North and South of the river? Or perhaps it’s time to accept that your model will only allow you to capture the market North of the river.
The above points are a few ideas to help get your market research off the ground. Each business will have unique scenarios and target markets so it’s important to keep applying techniques to your own situation but we hope the above points help you get started.
Read part 2 of this series here.