June 10, 2014
If you missed part 1 of this series, you can read it here.
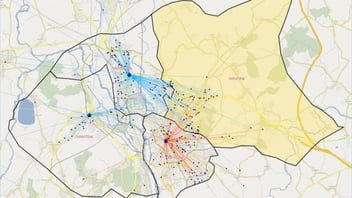
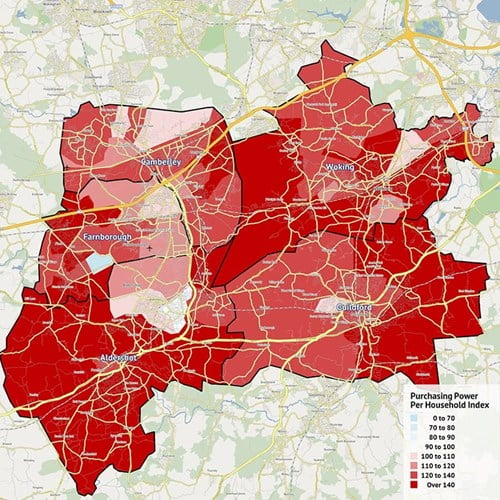
This time we have created some simple images to provide a visual overview of Guildford and the surrounding areas. The five localities have been separated out into individual territories and we can see that they are all relatively similar in size and composition. It is also interesting to note the wealth of this area, the average disposable income across the territories is over 30% higher than the national average.
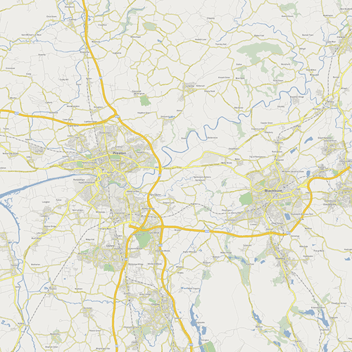
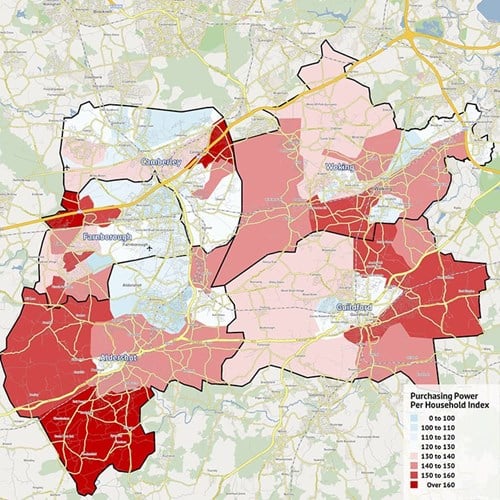
The images below show the area thematically shaded based on the national average and the areas average. As we have established, it is particularly wealthy and therefore in the first image, we can see a lot of red areas. However, if we change the thematic shading in line with this areas average wealth, we can see quite a different picture.
Now we can really start to see just where those extremely wealthy households are. It’s also noteworthy that in this example the Postcode Sectors that are particularly high in wealth tend to be located on the outskirts of the major towns, and the average to lower wealth households are more centrally located.
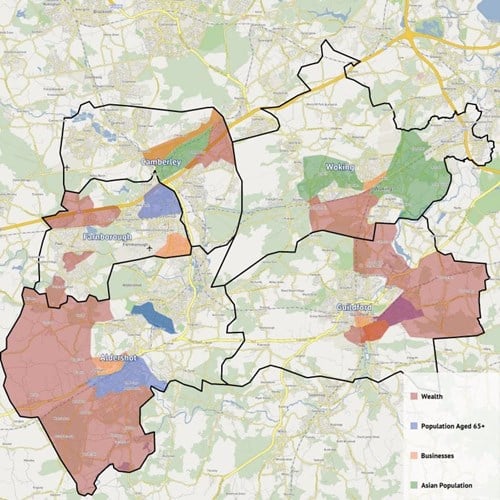
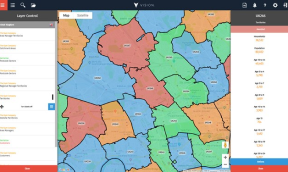
For this image, we have shaded the Postcode Sectors with the highest concentration of typically important demographics. This gives us a simple visualisation of the spread of each demographic and where the real hotspot areas are within this geographic area.
Wealth (Red) - We can see that the high wealth areas are actually pretty evenly spread throughout the territories, with Guildford and Fleet (within the Farnborough territory) holding the wealthiest Postcode Sectors.
Population Aged 65+ (Blue) - The larger older communities are established in the more Western territories.
Businesses (Orange) - As is to be expected high concentrations of businesses are found in every territory and represent where high streets, shopping centres, retail parks and industrial parks are located.
Asian Population (Green) – The areas of high Asian population can be found in the Northern territories of Woking and Camberley.