October 10, 2023
The short answer is yes, but only if your business is ready to manage the complications and complexities of a boundary and data update.
To access the latest demographic data, whether it’s the US 2020 demographics, the latest American Community Survey (ACS) demographics, or the newly added Data Axle business data, you must update to the latest versions of the geographic boundaries.
Updating your boundaries in Vision is easy, but the implications for your business can be significant. As most of our clients use the 5-digit ZCTAs, we will focus on them in this article. When updating the ZCTAs, you must manage territory border changes, new and removed ZCTAs, and any demographic changes. These can all impact your Franchise Disclosure Documents (FDDs), so please make sure you understand and have taken the necessary steps to manage these changes.
We have created a range of support documents to help carry out this update, whether you’re looking at doing it yourself or would like our help with one of our support packages.
Let's look at how a territory has changed.
In this section, we will have a detailed look into how a territory has changed since the last Census took place in 2010.
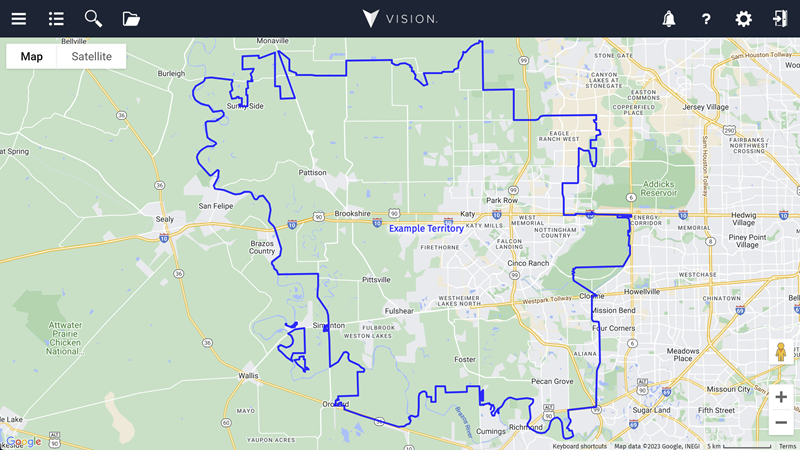
2010 Territory Boundary
2020 Territory Boundary
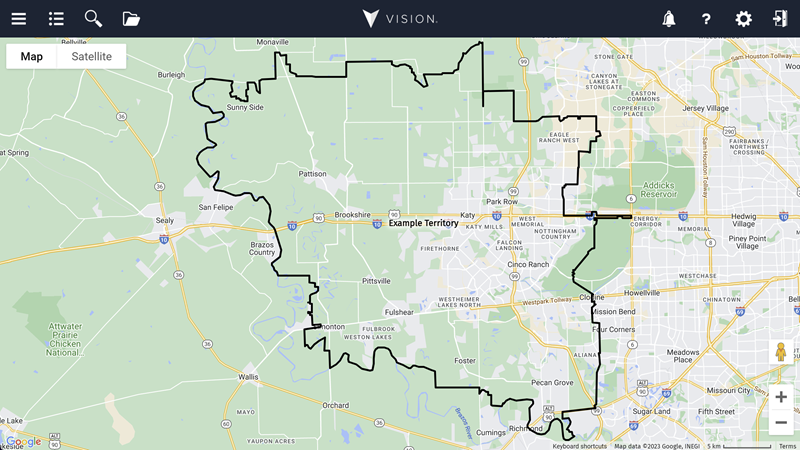
Most of the boundary changes are relatively minor, and there have been no added or removed ZCTAs. When we describe the border changes as minor, we refer to the fact that they mostly occur in more rural areas.
We recommend asking for some legal advice before carrying out the update to ensure everything is in order regarding your FDDs.
Demographics
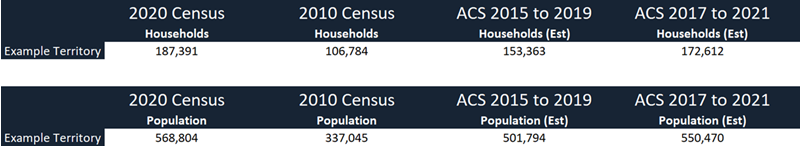
You can see how the demographics have changed across the different data releases. As you would expect, the most significant difference is between the 2010 and 2020 Census. You can then see how the most recent version of the ACS 5-year data is the closest to the 2020 Census data.
If you aren’t sure what the ACS data is, please look at this United States Census Bureau article for more information.
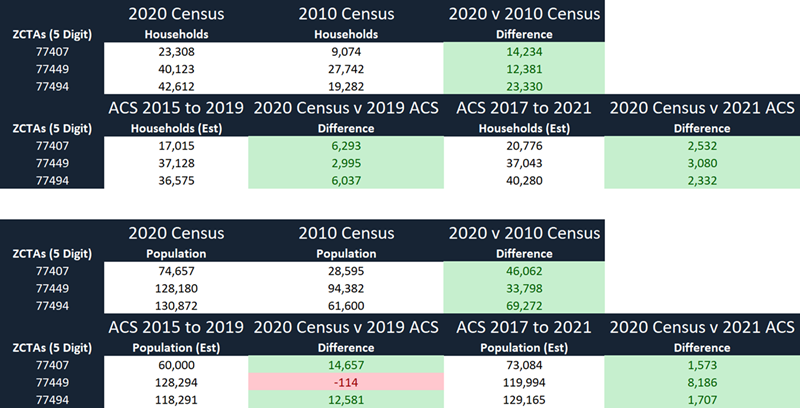
The image above shows some key ZCTAs belonging to the Example Territory. These have seen the biggest changes across the different data releases. Again, the most recent version of the ACS does a pretty good job of predicting demographic changes. However, it’s still a way off in some cases, particularly on the population estimate for the ZCTA of 77449. There is over 8,000 more population collected as part of the US Census compared to the predictions of the ACS.
Let's take a closer look at the changes.
Now that we’ve highlighted the movements in demographics for the whole territory and the individual ZCTAs, we can start to look even more closely at why they might have changed so drastically.
The images below are from the highlighted ZCTAs.
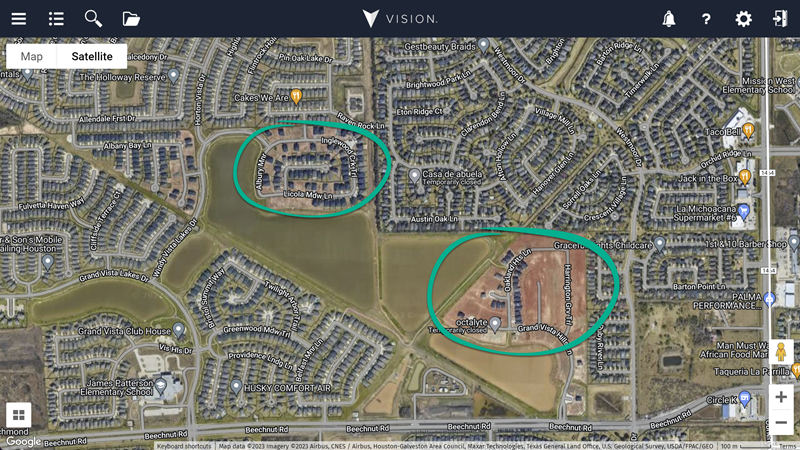
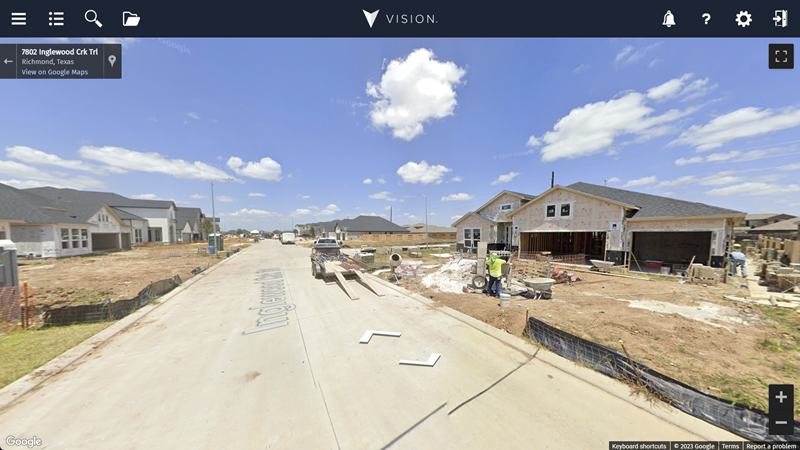
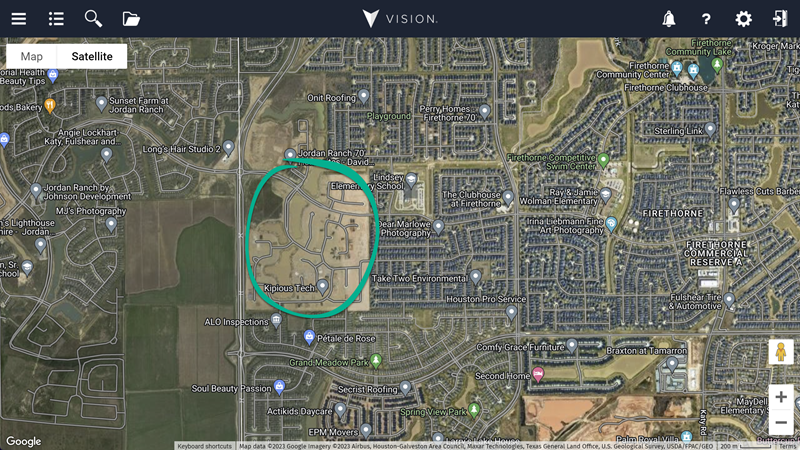
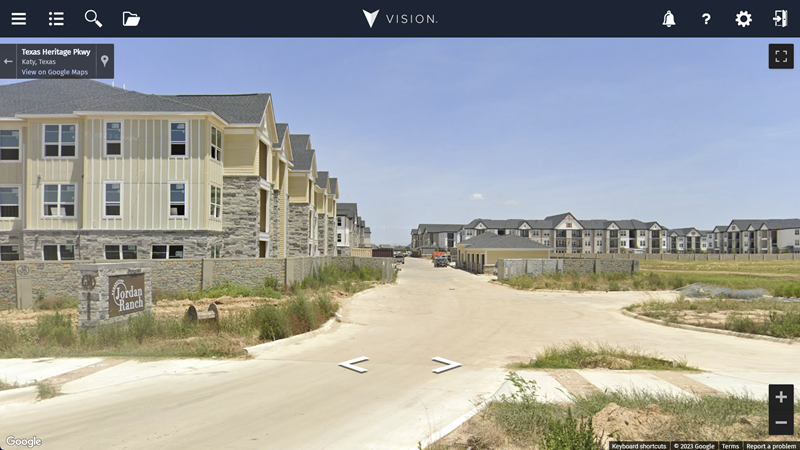
We’ve turned on the Satellite imagery to try and help us understand why the numbers have increased as much as they have. We’ve highlighted some current housing developments, and from what we can tell, those are being added to more extensive areas of development. Over 80,000 households have been built, and over 230,000 people have been added since the last census.
Unsure about anything?
We understand more than anyone how complicated these updates can be. We’ve spent months working on all the different update components and the supporting documents to try and make it as easy to understand and implement as possible. Unfortunately, there is no avoiding the complexities that come with updating to new geography and data.
If you would like to chat about anything relating to the update, then please get in touch, and we’d be happy to help.