March 4, 2015
In this blog, we take a look at the differences between a territory network created using a computer and a network created by ourselves, by hand. We chose to take a look at this subject as it’s a question typically asked, and a belief that territory mapping is little more than pressing a button to generate a network of territories in professional mapping software. So to try and illustrate the differences, we’ve created a number of images showing the variance in design and the drawbacks involved in automated territory design.
UK Networks
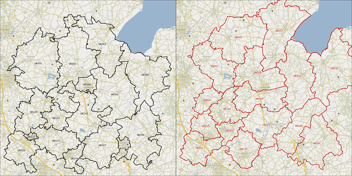
Firstly, here are the two networks. Are you able to firstly distinguish between the two, and secondly why? Here are a couple of things that stand out to us.
The Shapes
In the network created by the computer, you can see a lot of rough, jagged and what we call ‘snaking’ territories. This is where the program has tried to balance the numbers or opportunity in the territories by extending the borders out to capture areas and parts of other towns or locations. This is something that we take care to avoid as it doesn’t matter if that part or opportunity is in your territory, if a customer isn’t going to travel to you, or it’s inefficient for you to travel to them then it may as well not be included. This ensures that the markets we create are realistic, work from a network point of view, and make operational sense.
Major Locations
For the territories generated using the mapping software, we notice that some of them do not wholly contain a major city or town, in some cases just small parts of multiple locations are contained or worse yet they are completely rural. We have found that it’s important for a territory to be based around a hub of opportunity or population. This is the area that franchisees will be predominantly operating in, so it makes the most sense from a serviceability point of view.
We will always create territories in an area that is operational by ensuring that a minimum amount of commercial opportunity is contained within a geographic area that’s right for your business. We account for this by firstly having a good understanding of your business model (man in a van, single site, multiple sites or management), and also to look at drive times. This ensures that territories are only created in areas that can grow and sustain a successful business. For any areas in between, we will use expansion and excluded zones to allow you to best manage these areas moving forward.
London
This image shows how the two different approaches have been applied for an area in London. The black lines depict the computer version and the red are Atlas Mapping’s territories. The main difference that we note here are the boundaries.
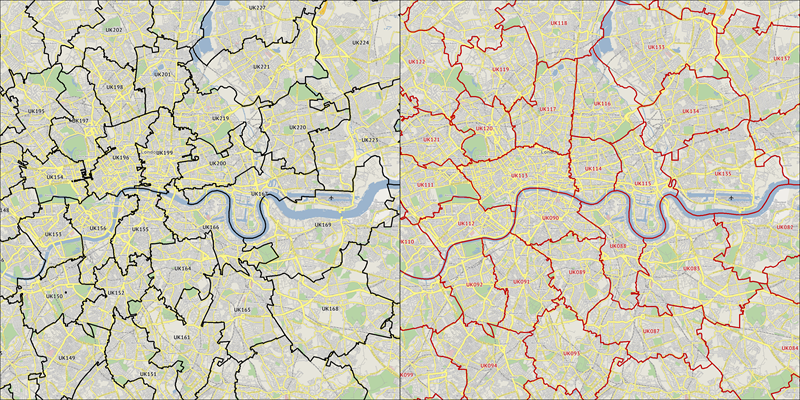
The Boundaries
When we look to create any territories, in particular, territories located within urban areas we pay special attention to boundary placement. Also when we refer to ‘boundaries’ we aren’t only referring to the actual territory boundary but more so the natural and manmade boundaries that exist and divide areas within towns and cities. The clearest boundary in London is the river. As you can see, we do not cross the river as it is a major boundary between the areas located on each side.
However, the computer’s territories ignore this and cross over a number of times. Some other examples of these boundaries are major roads and railways (over ground), normally you will find that these separate different localities within urban areas and if you look closely you will see how where possible we try to use these in our territory design, unlike the computer. This allows us to create territories that best re-create localised communities that should be kept together.
Read Part 2 of this blog where we drill down even further into the geography to take a look at the local implications of computer generated territories.