March 4, 2015
Following on from our previous blog we continue to take a look at the difference between computer generated territory networks and hand designed territories. If you missed Part 1, you can view it here.
Let’s take a closer look
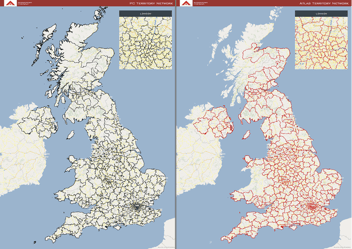
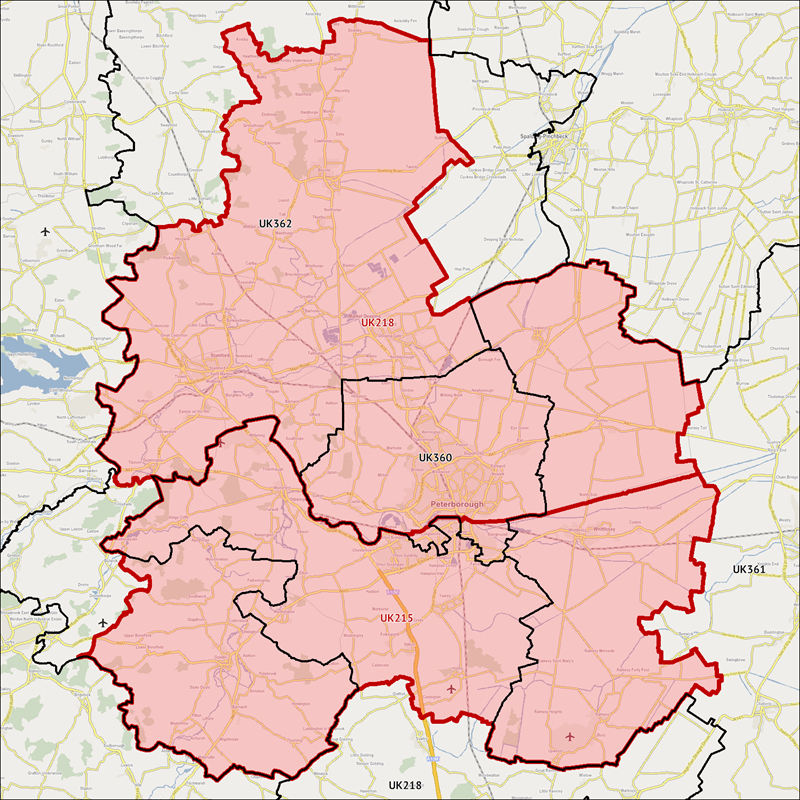
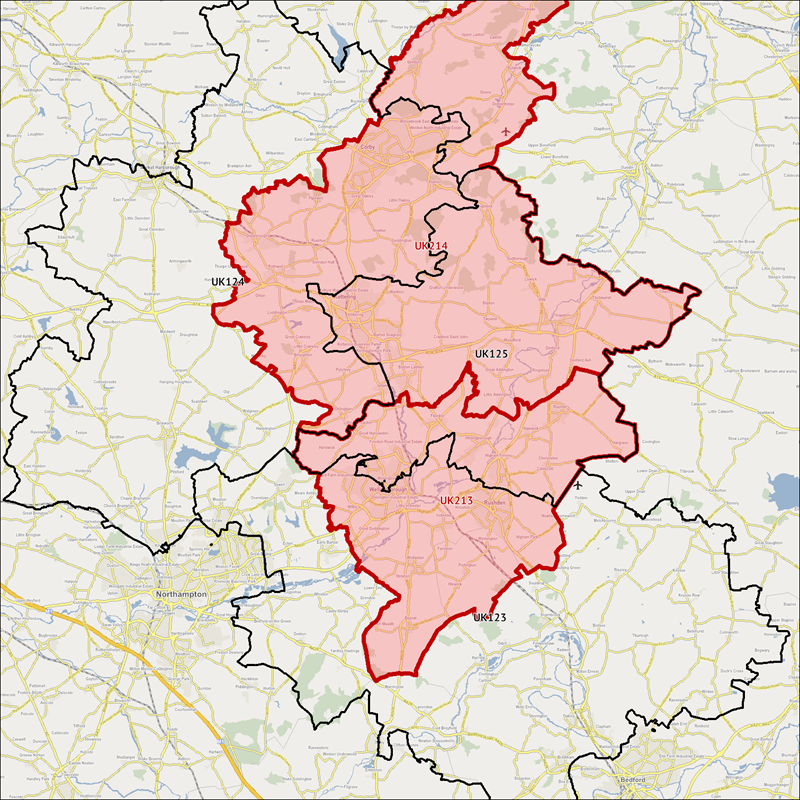
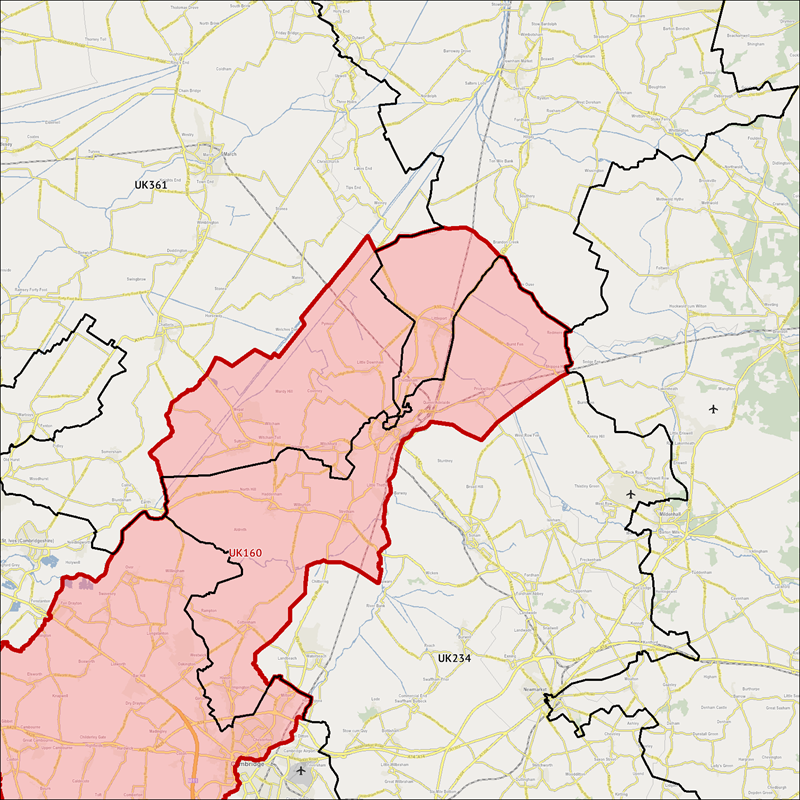
For this part of the comparison, we’ve zoomed into a smaller region. You can see by the black and red lines, just how different the two sets of territories are. Just to clarify, the black lines are the computer generated territories and the red lines are ours. Here’s the main difference that we saw between the two.
The Splits
Wherever we look in this region, we notice that a black line splits or cuts a town, city or locality. This is something that we look to avoid, unless it’s in a large town or city that can hold multiple territories, and splits in a sensible way. This can be seen in Cambridge, Northampton and Peterborough, such splits normally section the city or town by North/South or East/West, whichever works best with the transport infrastructure and layout of the city. However, the network generated by the computer splits almost all locations no matter what size, not only once but up to three times. This can be seen in places such as Ely and Grantham, which means that they could be serviced by up to three different franchisees!
An even closer look
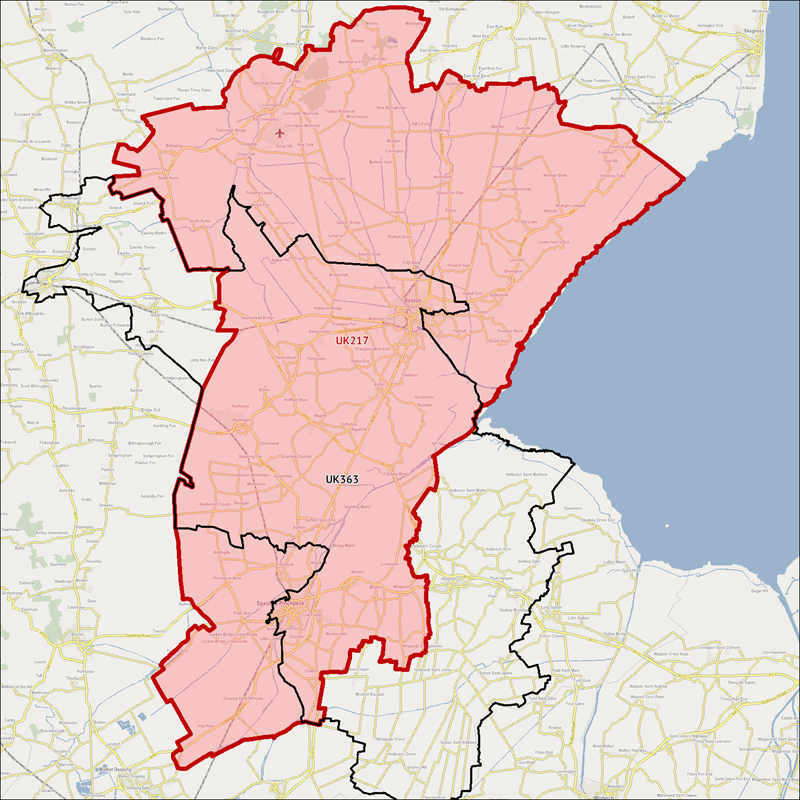
Example 1 shows a territory for territory contrast for a Boston - Spalding territory. In our interpretation for the area, we’ve looked to keep Boston and Spalding together and wholly contained within the territory as with the surrounding areas. However, the automated territory has split both Boston and Spalding, in our opinion it makes more sense operationally for one franchisee to service locations of this size.
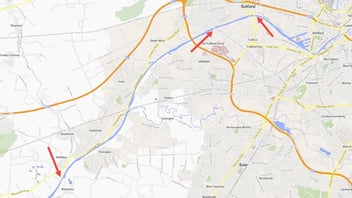
Example 2 highlights the difference in territory design for Peterborough and surrounds. We feel its best here to create two territories by splitting Peterborough into a North territory and a South territory by the river. Natural boundaries such as rivers normally provide a clear barrier between different parts or localities within a city. The computer has elected to divide Peterborough and the surrounding area between 4 different territories. Also though it’s almost created a similar North/South divide we can see that it has included two of the South Peterborough Postcodes in the North territory.
Example 3 shows how the market towns to the East of Northampton have been divided. We’ve kept neighbouring towns together that you would expect to be partnered with each other, whilst also following the road infrastructure. The computer again has split multiple towns between multiple territories and does not maximise the effectiveness of the road infrastructure. This can be seen with UK124 which includes the North of Northampton and Corby, and UK 123 which has East Northampton and down to the outskirts of Bedford.
Example 4 just provides a zoomed in view of Ely. Ely is a typically awkward area as it falls in between Peterborough and Cambridge, we’ve found that the roads and drive times lend themselves for it to be included within a Cambridge territory. As we noted before, the computer has split it three ways which means it could potentially be serviced by three different franchisees; this is definitely something that we would not create or recommend.
Final Say
After taking a look at the two different networks, we hope that we’ve helped to shed some light on the problems and limitations of automated territory design. It’s not to say that it definitely should not be done, it’s better to at least have some form of territory planning in place. However, it is very clear that the computer is unable to make key decisions when it comes the territory design, from an individual area and a network perspective. The problems that have been highlighted in this blog are not only limited to the areas that we have shown but happen time and time again, throughout the entire country.
We hope that you’ve found this article interesting and if you have any questions about our services or how we can help your business, please feel free to get in touch.


